Dimensionality is one of those concepts which has reached a higher level of complexity after the emergence of mathematics as an institutional discipline. Until the institutional split dimensionality was perceived as it had been understood from Euclid’s time. Visualizing dimensionality from that point of view was not particularly challenging. This changed with the introduction of one-sided surfaces, higher levels of dimensionality and fractal dimensions. Since then mathematicians have found several ways to make these abstract concepts more visualizable, and thus, easier to grasp.
The emergence of the discipline of pure mathematics.
Typically, pure mathematics is considered to be that subgenre of mathematics studied for its intrinsic value as opposed to applied mathematics. The distinction between pure and applied mathematics is, as most distinctions are, not all that clearly separated in reality. Nevertheless, it is a distinction enforced by the institutional separation of mathematics and physics. Before the eighteenth century, mathematics had mostly been valued for its role in the investigation of nature. Well-known contributors to mathematics also concerned themselves with science. Leibniz, Pascal and Fermat are examples of those who worked on mathematics as well as on other ways of investigating nature. Whatever mathematical research was done was founded by academies of science, not by universities. It was only in the early nineteenth century that mathematical research through universities became popular.
One of the early examples is that of Carl Jacobi, who started to lecture on elliptic functions in 1826 after Alexander von Humboldt had founded a university in Berlin where professors could choose the topics they would lecture on. The early nineteenth century also marked the emergence of research journals and professional societies focusing solely on mathematics. The French journal Annales de Mathématiques Pures et Appliquées was founded in 1810, and the German variant, Journal für die reine und angewandte Mathematik , was first published in 1826. These titles already display the distinction between pure and applied mathematics, showing that the scientific community was beginning to value mathematics beyond its application. Mathematics also began to be applied more broadly in disciplines such as chemistry and engineering, moving beyond its role as an instrument in physics. While amateur societies had been around before the eighteenth century, professionalization of the field only happened around the 1860s. The London Mathematical Society (1865), Société Mathématique de France (1872), the American Mathematical Society (1888) and the Deutsche Mathematiker-Vereinigung (1890) are examples of such professional societies.[1] The Dutch society, Koninklijk Wiskundig Genootschap, was founded as early as 1778, but, likewise, did not reach a professional status until it became more involved with national and international affairs in the 1860s.[2] The institutionalization of mathematics as its own discipline allowed mathematicians to focus on the less applicable mathematics. This, in turn, led to more abstract mathematical theories, such as the non-Euclidean geometry, higher algebra and group theory. With these more abstract theories came the need to reevaluate what was meant by dimensionality and how it should be visualized.
Dimensionality and its visualization
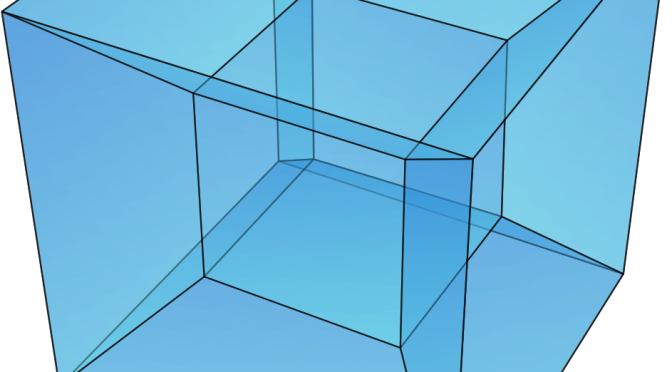
Nowadays, dimensionality typically is a richer concept for mathematicians and physicists than for those not educated in the sciences. In our Euclidean understanding of the world, altitude, latitude and longitude are sufficient to describe spatial relations. Three dimensions were and are relatively simple to visualize, as can be seen in the image below.

Nor is it difficult to give the illusion of three dimensions in a two-dimensional image. The suppression of dimensions is a tool that is often used by mathematicians and physicists to display particular information. Take image 2, for example. The S,t-diagram provides you with information about the distance travelled in a certain amount of time. However, compared to the Y,X-diagram, information about the particular spatial coordinates has been lost due to the suppression of the spatial dimensions into one spatial parameter. This can be understood by knowing that physicists use arrows to portray the direction and magnitude of a single spatial parameter. By suppressing two spatial parameters to a single parameter, two arrows are reduced to one, thereby losing information about the individual arrows in the graphic representation. Thus, depending on what information physicists want to have portrayed, they can choose to suppress other information.

Suppression of dimensionality can also be used for higher dimensional objects, spaces or systems. A concept that is typically associated with higher dimensions is the degree of freedom of a system. In mathematics, the degrees of freedom is the dimension of a set of solutions or of a space. In physics, however, the degrees of freedom denotes an independent physical parameter needed to describe the state of a physical system. The notion is thus more restricted in physics than in mathematics, and it furthermore need not be related to our daily perception of dimensionality. The physical processes can be visualized by drawing a diagram with two degrees of freedom. By choosing the specific parameters, the available information is limited to what can be drawn from the diagram. Choosing different parameters will lead to different information. However, two dimensions do not cover the kinds of systems that mathematicians and physicists are interested in. Every degree of freedom requires another dimension, otherwise information needed to determine the state of the system is lost. Dimensionality and visualizability play an important role in several mathematical and physical concepts. The three cases discussed in the following section will show that the notion of dimensionality has become a broader multiplicity which requires visualization in order to gain understanding.
A statement that neatly describes the importance of visualization is one made by E. Fischbein in 1987: “Visualization can accompany a symbolic development, since a visual image, by virtue of its concreteness, can be an essential factor for creating the feeling of self-evidence and immediacy”.[3] This is particularly true in the case of higher and fractal dimensions. First off, however, is a case in which a two-dimensional surface is best portrayed as a three-dimensional representation. The mathematicians A.F. Möbius and J.B. Listing in 1858 independently `discovered’ a two-dimensional, one-sided surface that is now known as the Möbius strip. From image 3a, which displays the Möbius strip as drawn by M.C.E. Escher, it should be understood what is meant by a two-dimensional, one-sided surface. By looking at the image, it is possible to imagine tracing the strip with a finger. From this, it should be clear that the finger tracing the band will return to its starting point without changing its direction or crossing an edge. Hence, the strip is two-dimensional in that it has no altitude and one-sided in that no edge needs to be crossed in trying to trace the entire surface. Thus, in this case the visualization of the Möbius strip has the potential to enlarge one’s understanding of the strip .
It was Möbius who, in 1827, thought of a fourth dimension which could be used as another, separate spatial direction. Even higher spatial dimensions were subsequently developed and used by Schläfi and Riemann, both mathematicians as well. Images definitively play a role in visualizing higher dimensions as even the most seasoned mathematicians have difficulty imagining more than four or five dimensions. And these higher dimensions are used in theories about chaotic dynamical systems and quantum phase spaces, theories on which we build our technology.

One of the mathematical tools which does make use of different levels of dimensionality is the Poincaré, or first recurrence, map. This method, not surprisingly, was first used by Poincaré in his 1890 paper Sur le problème nouvelles de la mécanique celeste. The Poincaré map is basically a dimensionally reduced representation of a dynamical system. The image showcases a lower-dimensional slice out of the higher-dimensional system, which makes it easier to find structures in systems that appear to be a tangled mess. In Poincaré’s case, the map allowed Michel Hénon to study the motion of stars better since their path projected onto a plane itself looks very unstructured. The images 3b and 3c are examples of chaotic behavior and its Poincaré map.[4] Using such maps, it becomes easier to visualize and imagine manipulating higher dimensions. This, in turn, relates to topology, the mathematical study of stretching and bending space and objects with different possible dimensions. The higher dimensionality is thus studied using different tools, not all of which refer to higher spatial dimensions.
The final case to be considered is that of fractal dimensionality, on which more can be read here. Fractal dimensionality is the dimensionality of a repeating pattern displayed at every scale. The easiest way to visualize this is to look at the Koch snowflake, image 3d, and to imagine zooming out or in to the snowflake. The image is created to have triangles added onto every side of the existing triangles so that no matter at which scale one looks, the patterns should remain the same. In this case dimension does not refer to a property of space but to the manner in which points in the fractal are distributed. While fractals were briefly studied in the seventeenth century , they did not emerge as the fractals we know nowadays until 1872. This was when K. Weierstrass presented the first definition of a function with a graph of a fractal. H. von Koch gave a more geometric discussion in 1904. His account included several hand drawn images. Nonetheless, it was B. Mandelbrot who first discussed the fractal dimensions in 1967. He was the one who made the move from integer dimensions to fractional dimensions. In this case dimensionality is given by the division of the logarithm of the number of self-similar pieces by the logarithm of the scaling factor, or d=Log(P)/Log(S). For the Koch snowflake, each triangle is put on the middle third part of the larger triangle, creating four self-similar pieces. Thus, the dimension of the snowflake turns out to be Log(4)/Log(3)≈1.261(8).[5] Despite this notion of dimensionality being very different from the other notions, it remains that visualizability is essential. It would be very difficult to grasp the complex, infinite self-embedding of fractals without any image.
Conclusively, the role of images and diagrams in mathematics and physics is and has been significant, especially after the institutionalization of mathematics. The role of the visual, not just the image but also the three-dimensional models, is absolutely relevant in addition to the more verbally-oriented mathematics since it enhances the intelligibility, understanding, and explanation of the more abstract mathematical concepts. As our comprehension of what dimensionality is has changed and expanded, images have played a more a peripheral role in it.
o-o-o
Images 1, 2 and 3d are based on existing images. Image 1 is based on an image found at http://en.wikipedia.org/wiki/Dimension_(mathematics_and_physics), image 2 is based on standard diagrams in physics, and image 3d is based on http://en.wikipedia.org/wiki/Koch_snowflake.
Image 3a is a surreal painting from 1964 by Escher called Moebius Strip II.
Images 3b and 3c are taken from Gleick (2008), p. 100.
Sources:
[1] Kline, M. (1990). Mathematical Thought from Ancient to Modern Times Vol.2. Oxford: Oxford University Press.
[2] Beckers, D. (2008). The Royal Dutch Mathematical Society since 1778. Nieuw Archief voor Wiskunde 9(2).
[3] Arcavi, A. (1991). The Role of Visual Representation in the Learning of Mathematics. Proceedings of the Annual Meeting of the North American Chapter of the International Group for the Psychology of Mathematics Education.
[4] Gleick, J. (2008). Chaos: Making a New Science. New York: Open Road.
[5] Mandelbrot, B.B. (1982). The Fractal Geometry of Nature. New York: W.H. Freeman and Company.
[-] Deser, S. (2004). The Many Dimensions of Dimension. Phys-Math, 166, 65.
[-] Netz, R. (1998). Greek Mathematical Diagrams: Their Use and Their Meaning. For the Learning of Mathematics 18(3).
[-] Rouse Ball, W.W. (2010). A Short Account of the History of Mathematics. Dover Books.